Learn to Break Down a Stock Quote So You Can Make More Money


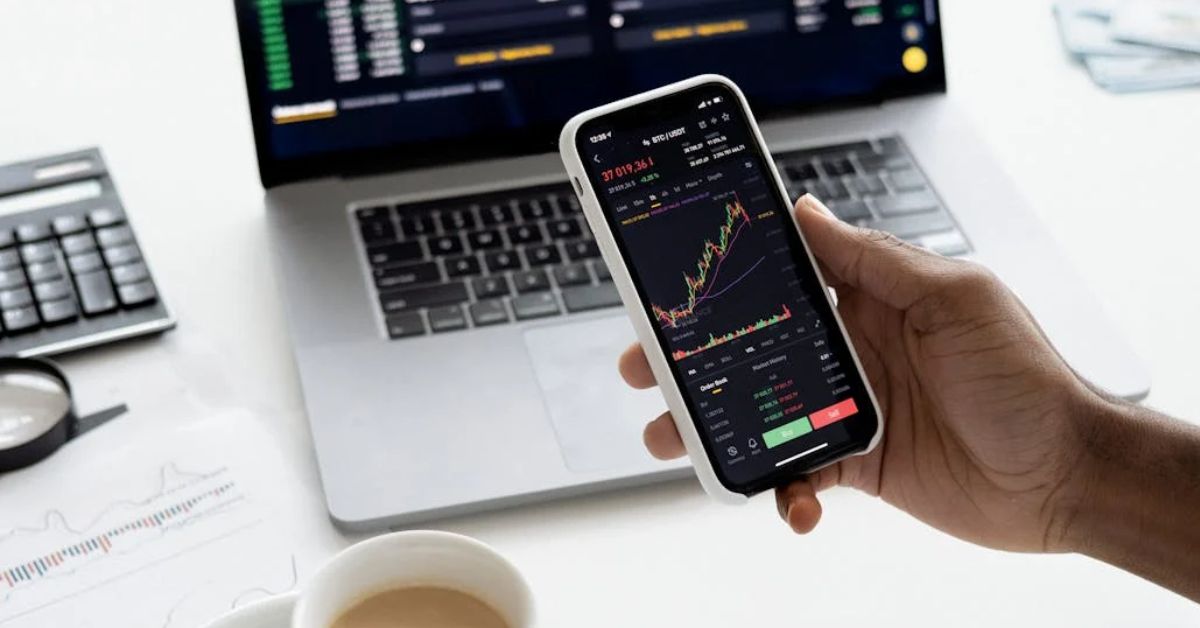
The scrolling ticker on TV financial shows stream stock prices at a dizzying rate. Disney is at $185 a share! Apple is $128! And, wow, Caterpillar has jumped over $240!
It’s exciting to watch the prices of stocks bounce up and down, but it can be hard to get an idea about whether to buy, sell or hold. It all makes more sense when you know how the stock has traded in the past, how risky of an investment it is now, and how the company has been performing.
If you are already investing in the market or want to start, you should know how to read a stock quote to gauge how much a stock is worth and how it’s been performing. This helps you know if you want to buy or sell.
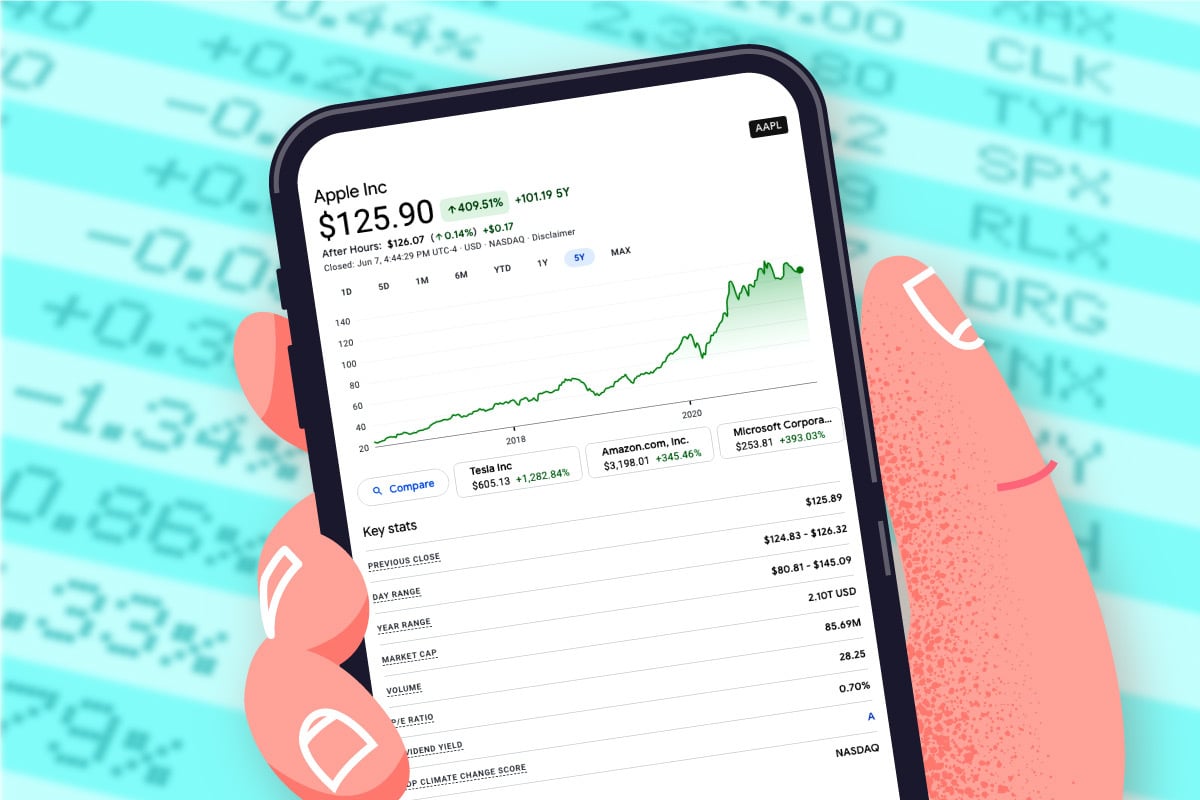
Stock quotes from finance sites or search engines provide much more information than the current price which you see on the TV scroll or read about in a general article.
Once you know how to read a stock quote, you’ll have a better idea of whether the stock could be overpriced or a bargain. You can also learn whether investor interest in the stock is increasing, stable or declining.
Getting Familiar with How to Read a Stock Quote
For this story, we’ll break down common items in a stock quote into three kinds of information:
- How a stock is trading now.
- How a stock has traded in the past.
- What a share in the company represents.
Knowing this information will position you better for investing success on the stock exchange. Here, we build on the helpful tips in our Investing for Beginners: A Crash Course On Making Your Money Grow. Think of that as Investing 101, and then this as Investing 202.
How a Stock is Trading Now
The most prominent price in a stock quote is the last price the stock was bought or sold. If you’re buying or selling the stock of a widely recognized company when the stock market is open, the next trade should be close to that price.
There are some situations when your trade might not be executed close to the last price. If you’re trading penny stocks or a company that’s just announced its quarterly results or important news, then you should check the actual prices other investors or traders are willing to buy or sell shares. If you don’t, you could get a price you weren’t expecting.
The Bid and the Ask
If you plan to sell, look at the bid. That’s the best price another investor is willing to buy the stock if you place a market order. If you want to buy shares, then you should look at the ask, which is the lowest price someone is willing to accept to sell shares to you or anyone else.
The difference between the bid and the ask prices is the “spread,” and it’s a cost, just like driving a new car off the dealer lot. You know how someone always says when you buy a new car, it loses 40% or some such number the minute you drive it off the lot? The same is true of buying a stock on the market. Most of the time, the spread is only a penny or two for the most popular stocks.
The Closing and The Opening
The closing price is the stock price as of the last trade of the previous trading day. If it’s Monday, that would be Friday.
The opening price is where the stock traded at the beginning of the current trading day. If there’s a big difference between the two, there may have been news on the company overnight or over the weekend, such as the company making a big acquisition or introducing a monster product.
The Market Cap
Market capitalization, or market cap, is the total value of the company’s outstanding shares. Investors divvy up companies according to their market capitalizations, because the stock of larger companies tend to be safer than smaller companies and smaller companies tend to return more on average than larger companies (though they’re riskier).
That difference between large, safer stocks and smaller but riskier stocks is why mutual fund companies offer large cap and small cap funds.
Just because a company is small doesn’t automatically mean it’ll go up faster than every large cap stock, and large companies aren’t always dull, either. Companies’ market caps can go down (think Lehman Brothers and the original General Motors stock) and, likewise, they can skyrocket. Apple used to be a small cap company, but it grew to be a “megacap” company worth over $2 trillion. Apple bore a lot of fruit for its investors, didn’t it?
How a Stock Has Traded on the Stock Exchange
The 52-week range gives us an idea about the stock’s past performance and its volatility. It’s the difference between the highest and lowest price for the stock in the past year. Instead of a range, you could see the 52-week high and the 52-week low.
Don’t get too hung up on whether a company is at the top or bottom of its range. It can go higher and, unless it’s at zero, it can go lower. Range is helpful, but what really matters is whether the price is justified when compared to the future outlook for the company.
Understanding Volume
Volume is the number of shares traded that day and provides us some idea about how easy it is to buy and sell at market prices (professionals call that liquidity). The number alone doesn’t tell us much until you compare it to the volume on a chart. If volume spikes suddenly, then you should check recent news on the company.
It’s also important when trading thinly traded stocks. Most of us aren’t able to disrupt the market for Apple or Tesla stock, but even small orders can be difficult to execute on penny stocks. This is one of very many good reasons not to buy penny stocks unless you understand what you are doing. They could easily leave you broke.
Before you buy or sell shares of a small company, check the volume. If your trade is large compared to the average daily volume, you may get a price different from the posted bid or ask price or the previous day’s close because you’ll overwhelm the market. Some posted bids or ask prices are only good for 100 shares.
Know the Beta of a Stock Price
Beta is the term used in the financial world to compares the risk of a stock compared to the rest of the stock market. A beta of one is normal risk. A beta of less than one implies the stock won’t go up or down as much as the market. Utility stocks have predictable profits, so they tend to have low betas. For example, the Detroit-based diversified energy company DTE Energy (NYSE: DTE) recently had a beta of 0.63.
A beta of more than one means the stock has fluctuated more than the rest of the market. The higher the beta, the more upside you should expect to get for buying the stock and the less surprised you should be if the stock goes down more than the rest of the market. Tesla’s stock (OTC:TSLA) had a beta as high as 2.
What a Share in The Company Represents
Some stocks pay a dividend, which is regular cash paid out to owners of the stock. The dividend listed in the quote is usually the dividends paid over the past 12 months. The following information will help you understand more about the lingo of the stock quote.
Understanding Yield
The yield is your expected return as a percentage instead of a dollar figure. A dividend yield of 3% means that for every $100 dollars invested, the stock paid $3 in dividends over the past year.
The more the company pays its profits out in cash, the less it has available to expand. That’s why growth companies don’t pay high dividends and mature companies with fewer growth opportunities do. Slow growing companies pay high dividends to reward investors for owning their shares, since they are less likely to skyrocket in value than a growing company.
The Value of Earnings Per Share
Companies report their after-tax profits as “earnings.” The more profit your share makes, the more valuable your share in the company becomes to potential buyers. Earnings per share, or EPS, is the company’s net profit divided by the number of publicly traded shares.
The price to earnings ratio, or P/E, lets us know how much each dollar of profit costs in the stock’s price. It’s the price per share divided by the last 12 months of the company’s earnings.
The higher the price-earnings ratio, the more optimistic the market is about the shares. Value investors seek out stocks with low price-earnings ratios but excellent prospects. Those may be a bargain, but not if the company is in trouble. Different industries carry different price-earnings ratios, so compare the ratio of the company you’re following to other companies in the same industry.
For example, in mid-May 2021, the P/E for Apple was about 27.9 compared to about 13.4 for Samsung. So you could surmise that the market is more optimistic about Apple than Samsung. Caterpillar and John Deere, which both manufacture heavy agricultural equipment, were closer, 38.74 and 34.59 respectively. This tells you the market is rosy about both.
Studying Stock Quotes
As you become more acquainted with how to read a stock quote, you will become more comfortable — or at least knowledgeable — about the ups and downs of the markets.
Eventually, you’ll begin to spot what’s normal movement and when you should be checking the news to see what’s driving those big price changes. It’s worth it. Learning how to read stock quotes is an essential step toward becoming a confident stock investor.
Contributor Sam Levine holds Chartered Financial Analyst® and Chartered Market Technician® designations and has written on finance topics since 2003. He is an adjunct professor of finance at Wayne State University in Michigan.